How to create new EC2 instance in AWS console using new UI experience?
What is EC2 instance?
It is virtual server provided by AWS. We will be using this EC2 to setup both Jenkins and Tomcat. Please follow the below steps to create an EC2 instance.Watch in YouTube for a demo:
Steps:
1: Login to AWS console by clicking this link --> https://aws.amazon.com/console/
1: Login to AWS console by clicking this link --> https://aws.amazon.com/console/
click on All services, Click on Compute --> Click on EC2

2. Click on Launch instance
3. Enter Name as EC2 and enter 2 as number of instances (one for Jenkins and another for Tomcat)

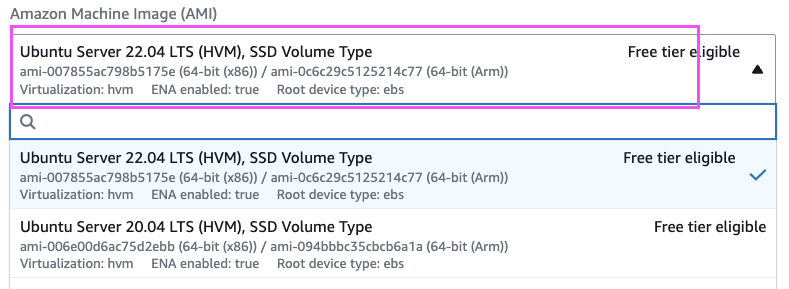
4. Select Ubuntu

and choose Ubuntu server 22.0.4 as AMI
5. Enter t2.small as instance type
6. Click on Create new Key Pair

7. Choose the existing key pair if you have one, otherwise create new one, give some name as myJenkinsKey. Make sure you download the key in your local machine. Please do NOT give space or any character while naming the key.


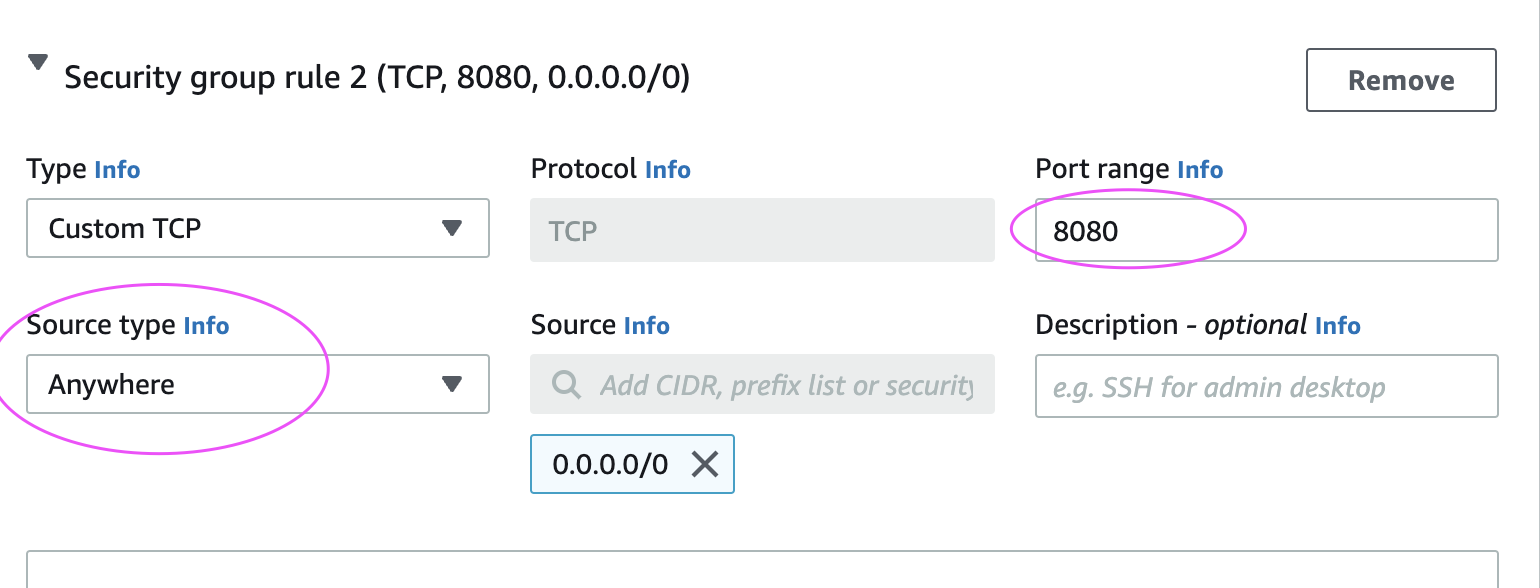
Add port range as 8080 and select AnyWhere as Source Type, that should enter 0.0.0.0/0 as Source

Enter 15 GB as root volume

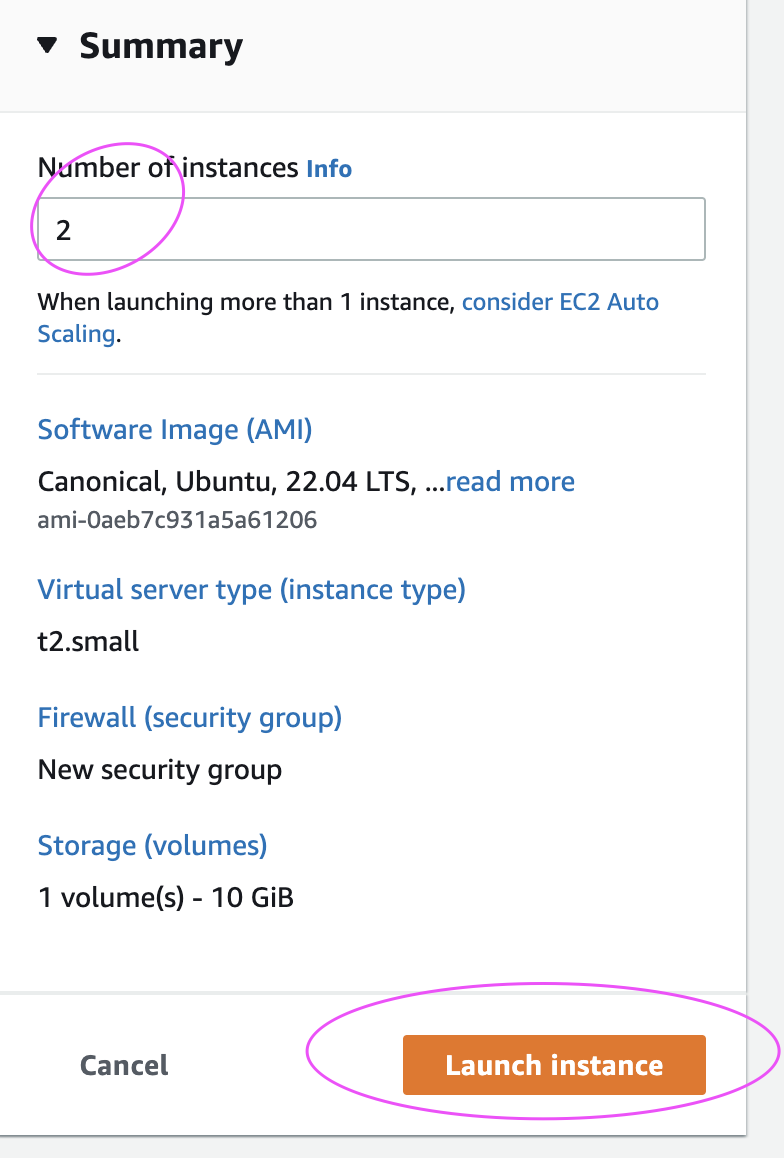
10. Click on Launch Instance.
Click on View instances

Now you should be able to view instances in AWS console. Now you can re-name as Jenkins-EC2 and Tomcat-EC2

Connect to EC2 instance from local machine:
Please click the below link to understand the steps for connecting to EC2 instance from your local machine - windows or Apple laptop.
Please click the below link to understand the steps for connecting to EC2 instance from your local machine - windows or Apple laptop.
http://www.cidevops.com/2018/0


